Speaker Recognition software has become more popular with the advances in deep learning and the adaption of voice AI, enabling several use cases in various industries such as communications, law enforcement, media, and entertainment. It is a complex technology, and there are many factors one should consider before making a purchase decision. The performance is the most important yet challenging one.
This article aims to help readers compare the performance of Speaker Recognition algorithms and understand the nuances of reading the results. It focuses on the most commonly used metrics, False Acceptance Rate, False Rejection Rate & Equal Error Rate, and their visual presentation, Detection Error Trade-off curve. However, it’s essential to note that external factors, such as the test dataset and environment, affect the results. Therefore, comparing the performance of engines tested with different datasets in different settings leads to incorrect conclusions. Before comparing results, one should ensure external factors do not differ. Examples of external factors are:
- Environmental noise, speech-to-noise ratio, echo, and reverberation
- Distance to the source of audio
- Enrollment audio quality & quantity
- Microphone and audio channel characteristics
What’s the False Acceptance Rate (FAR)?
The False Acceptance Rate (FAR) indicates the presence of a condition when it’s not there. For Speaker Recognition software, False Acceptance (FA) means the software recognizes a speaker incorrectly when the sample voice doesn’t match the speaker’s original voiceprint. If speaker recognition software matches Speaker A with Speaker B, it’s considered a False Acceptance. FAR is the ratio of incorrectly recognized speakers to the total number of attempts.
What’s the False Rejection Rate (FRR)?
The False Rejection Rate (FRR) indicates the absence of a condition when it is present. For Speaker Recognition software, False Rejection means the software misses recognizing a known speaker. If Speaker Recognition software cannot match Speaker A to the original voiceprint of Speaker A, it’s considered a False Rejection (FR). FRR is the ratio of incorrectly missed speakers to the total number of attempts.
Adjusting the threshold levels for acceptance (and rejection) changes the FAR and FRR values. For example, by increasing the acceptance threshold level, any engine can achieve a 0 FAR but with a higher FRR, while lowering the threshold level can result in a 0 FRR but with a higher FAR.
If a vendor claims high accuracy due to a low FAR (or FRR) without mentioning FRR (or FAR), ask for the second metric.
What’s the Equal Error Rate (EER)?
The Equal Error Rate (ERR) is the threshold at which the FAR equals the FRR. It's a better measure than using FAR or FRR alone because it balances them. A lower EER indicates better performance. However, the EER only provides information at a specific threshold level and doesn't cover performance across all thresholds.
What’s the Detection Error Trade-off (DET)?
The Detection Error Trade-off (DET) is a variant of the ROC curve that compares FRR to FAR at various threshold levels. Thus, DET is better at assessing the effectiveness of Speaker Recognition systems. It provides a comprehensive comparison between models across a range of thresholds.
It’s not always easy to compare multiple DET curves visually. Researchers need a numerical value to compare DET curves. Thus, they calculate the area under the DET curve, known as Area Under the Curve (AUC). AUC is a numerical value representing how likely a model has false predictions. The lower the AUC, the better, meaning fewer false predictions. In other words, a model with a low AUC is better at correctly classifying true positive and true negative voice samples, meaning lower FRR and FAR values. Thus, an engine with the smallest area under the DET curve performs better than the others.
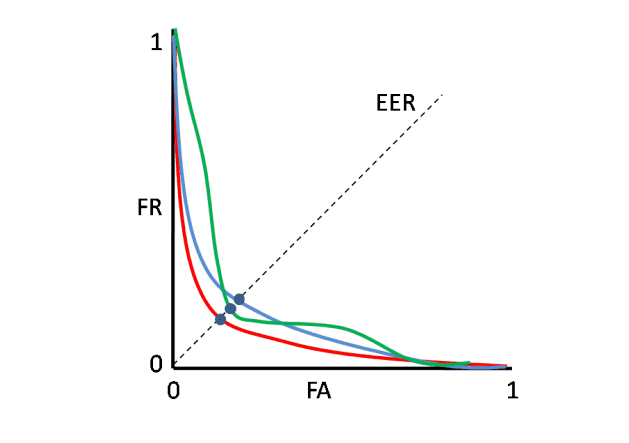
Figure: DET curves for three different classifiers.
Optimization of the DET curve in speaker verification
The red, blue, and green DET curves above represent the performances of three engines. On the left-hand side of the graph, FRR is the highest, and FAR is the lowest, meaning the acceptance threshold is high. As we lower the threshold, i.e., we move toward the right on the graph, FRR decreases, FAR increases, and they become equal at the EER value. The dotted black line with a 45-degree angle shows the EER. The EER line intersects with DET curves only once, meaning at one threshold level, not across all.
The blue curve performs better than the green curve across most threshold levels. The area below the blue curves is smaller. However, the EER value of the green one is lower than the blue one. That’s why comparing engines based solely on FAR, FRR, or EER can be misleading and lead to incorrect conclusions.
Start using Eagle Speaker Recognition to see how best-in-class Speaker Recognition and Identification performs. If you need help with comparing the performance of different Speaker Recognition and Identification alternatives specific to your use case, consult Picovoice Experts.

